| |||||||||||||||||||||||||||||||||||||||||||||||||||||||||||||||||||||||
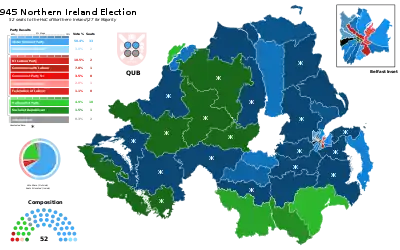
All 52 seats to the House of Commons of Northern Ireland 27 seats were needed for a majority | |||||||||||||||||||||||||||||||||||||||||||||||||||||||||||||||||||||||
|---|---|---|---|---|---|---|---|---|---|---|---|---|---|---|---|---|---|---|---|---|---|---|---|---|---|---|---|---|---|---|---|---|---|---|---|---|---|---|---|---|---|---|---|---|---|---|---|---|---|---|---|---|---|---|---|---|---|---|---|---|---|---|---|---|---|---|---|---|---|---|---|
| |||||||||||||||||||||||||||||||||||||||||||||||||||||||||||||||||||||||
 Percentage of seats gained by each of the party | |||||||||||||||||||||||||||||||||||||||||||||||||||||||||||||||||||||||
| |||||||||||||||||||||||||||||||||||||||||||||||||||||||||||||||||||||||


| (1921–72) |
.svg.png.webp) |
|---|
The 1945 Northern Ireland general election was held on 14 June 1945. The election saw significant losses for the Ulster Unionist Party, though they retained their majority.
20 MPs were elected unopposed (38%), the vast majority of whom were Ulster Unionists. Four MPs affiliated with the labour movement were elected, a new record that would not be surpassed until 1958.[nb 1]
Results
| 33 | 10 | 2 | 2 | 5 |
| UUP | Nationalist | L | IU | Oth |
| 1945 Northern Ireland general election | |||||||||||||||
|---|---|---|---|---|---|---|---|---|---|---|---|---|---|---|---|
 | |||||||||||||||
| Party | Candidates | Votes | |||||||||||||
| Stood | Elected | Gained | Unseated | Net | % of total | % | No. | Net % | |||||||
| Ulster Unionist | 41 | 33 | 0 | 6 | -6 | 63.5 | 50.4 | 180,342 | -6.4 | ||||||
| NI Labour | 15 | 2 | 2 | 1 | +1 | 3.8 | 18.5 | 66,053 | +12.8 | ||||||
| Nationalist | 11 | 10 | 2 | 0 | +2 | 19.2 | 9.1 | 32,546 | +4.2 | ||||||
| Commonwealth Labour | 6 | 1 | 1 | 0 | +1 | 1.9 | 7.8 | 28,079 | N/A | ||||||
| Ind. Unionist | 5 | 2 | 1 | 1 | 0 | 3.8 | 5.0 | 17,906 | -1.8 | ||||||
| Communist (NI) | 3 | 0 | 0 | 0 | 0 | 3.5 | 12,456 | N/A | |||||||
| Independent Labour | 2 | 1 | 0 | 0 | 0 | 1.9 | 2.8 | 9,872 | +1.1 | ||||||
| Socialist Republican | 2 | 1 | 1 | 0 | +1 | 1.9 | 1.5 | 5,497 | N/A | ||||||
| Federation of Labour | 1 | 0 | 0 | 0 | 0 | 1.1 | 3,912 | N/A | |||||||
| Independent | 2 | 2 | 2 | 0 | +2 | 3.8 | 0.3 | 1,219 | -1.9 | ||||||
Electorate: 845,964 (509,098 in contested seats); Turnout: 70.3% (357,882).
Votes summary
Seats summary
Uncontested seats
In 20 of the 52 seats (38%), only one candidate stood and they were elected unopposed without any votes cast. The vast majority of the MPs elected without a contest were Ulster Unionists.
| 1945 Northern Ireland general election (uncontested seats) | |||||||||||||||
|---|---|---|---|---|---|---|---|---|---|---|---|---|---|---|---|
| Party | Popular vote | Candidates | |||||||||||||
| Votes | % | Stood | Elected | % | |||||||||||
| Ulster Unionist | Unopposed | 13 | 13 | 65.0 | |||||||||||
| Nationalist | Unopposed | 6 | 6 | 30.0 | |||||||||||
| Ind. Unionist | Unopposed | 1 | 1 | 5.0 | |||||||||||
| Total | 20 | 20 | 100 | ||||||||||||
Footnotes
- ↑ 2 seats for the Northern Ireland Labour Party, one seat for the Commonwealth Labour Party and one Independent Labour MP.
See also
References
- Northern Ireland Parliamentary Election Results Archived 16 November 2017 at the Wayback Machine
- ↑ Includes 13 members elected unopposed.
- ↑ Includes 6 members elected unopposed.
This article is issued from Wikipedia. The text is licensed under Creative Commons - Attribution - Sharealike. Additional terms may apply for the media files.