| Hexham | |
|---|---|
| County constituency for the House of Commons | |
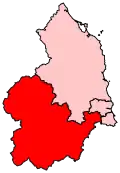 Boundary of Hexham in Northumberland | |
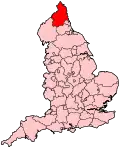 Location of Northumberland within England | |
| County | Northumberland |
| Electorate | 60,499 (December 2010)[1] |
| Major settlements | Hexham, Corbridge, Stocksfield, Ponteland, Prudhoe, Wylam, Haydon Bridge, Haltwhistle |
| Current constituency | |
| Created | 1885 |
| Member of Parliament | Guy Opperman (Conservative) |
| Seats | One |
| Created from | North Northumberland and South Northumberland |
Hexham is a constituency[n 1] in Northumberland represented in the House of Commons of the UK Parliament since 2010 by Guy Opperman, a Conservative. As with all constituencies, the constituency elects one Member of Parliament (MP) by the first past the post system of election at least every five years.
The seat was created as one of four single member divisions of the county of Northumberland under the Redistribution of Seats Act 1885.[2]
Constituency profile
The second-largest constituency by land area in England (covering 250,992 hectares),[3] Hexham reaches to the Pennines and is traversed by Hadrian's Wall, which runs almost due east–west through England. It includes substantial agricultural holdings, forestry, wood processing, food, minerals, and manufactured hardware industries. In the midst of the northwest of the constituency is Kielder Water; running between this area and the middle of the seat is the southern portion of Kielder Forest, and in the west, the attractions of the precipitous Haltwhistle Burn, Viaduct and Castle. SSE of Hexham is the Derwent Reservoir.[4] As well as those rural areas, the constituency also includes part of Newcastle's middle-class suburbs.
Hexham has been held by the Conservative Party, and generally with safe majorities, since 1924. It was the only Conservative seat in the North East between the New Labour years in government from 1997-2010, and the only one in Northumberland from 1973 until the Conservatives gained Berwick-upon-Tweed from the Liberal Democrats in 2015. It was also the northernmost seat won by the Conservatives in 1997, in what would be their worst landslide defeat at any general election of the twentieth century; with all Conservative MPs in Scotland and Wales unseated that year.[5] Despite this middle-class segment of the population, there are also some more working-class areas: Prudhoe frequently elects Labour councillors and has demographics similar to neighbouring parts of Blaydon, a safe Labour seat. There is also some deprivation in rural areas, particularly around Haltwhistle.
Based on the latest published old age dependency ratios, a slightly larger than average level of the population is retired.[6] In 1997, the Labour Party was very close to winning the seat, but the Conservatives retained it with a significantly reduced narrow majority of 222 votes. Hexham is considered a safe seat for the Conservative Party, having been under their control for almost a century.[7]
An estimate by the House of Commons Library puts the Leave vote by the constituency in the 2016 referendum at 45%.[8]
Boundaries
1885–1918: The Sessional Divisions of Bellingham, Coquetdale West, Haltwhistle, and Tynedale.[2]
The contents of the county division were defined by the Redistribution of Seats Act 1885.
1918–1950: The Rural Districts of Bellingham, Haltwhistle, Hexham, and the part of the Rural District of Castle Ward which consists of the civil parishes of Bitchfield, Black Heddon, Capheaton, Cheeseburn Grange, East Matfen, Fenwick, Harlow Hill, Hawkwell, Heugh, Ingoe, Kearsley, Kirkheaton, Nesbitt, Ouston, Ryal, Wallridge and West Matfen, and the Urban Districts of Hexham and Prudhoe.[9][10]
Rothbury was transferred to Berwick-upon-Tweed.
1950–1974: The Urban Districts of Hexham and Prudhoe, and the Rural Districts of Bellingham, Castle Ward, Haltwhistle, Hexham.[11][12]
The remainder of Castle Ward was transferred from the abolished constituency of Wansbeck.
1974–1983: The urban districts of Hexham and Prudhoe, and the rural districts of Bellingham, Castle Ward, Haltwhistle, and Hexham.[13]
The boundary with Blyth was slightly amended to take account of changes to local government boundaries.
1983–2010: The District of Tynedale, and the following wards of the Borough of Castle Morpeth: Heddon-on-the-Wall, Ponteland East, Ponteland North, Ponteland South, Ponteland West, Stamfordham, Stannington, and Whalton.[14][15]
Contents changed following reorganisation of local authorities in 1974. The area of the former rural district of Castle Ward which was now part of the City of Newcastle upon Tyne in Tyne and Wear was now included in Newcastle upon Tyne North.
2010–present: The District of Tynedale, and the following wards of the Borough of Castle Morpeth: Heddon-on-the-Wall, Ponteland East, Ponteland North, Ponteland South, Ponteland West, Stamfordham, and Stannington.[16]
2007 boundary review
In the fifth periodic boundary review of parliamentary representation in Northumberland, which came into effect for the 2010 general election, the contents of the existing Hexham constituency were unchanged except for losing the southern part of the Hartburn ward to Berwick-upon-Tweed, and the Boundary Commission for England made only minor changes in Northumberland to take account of ward boundary changes.
In 2009, a further government reorganisation resulted in the abolition of all local government boroughs and districts in Northumberland and the establishment of the county as a unitary authority.[17] However, this has not affected the current constituency boundaries.
Proposed
Further to the 2023 Periodic Review of Westminster constituencies, enacted by the Parliamentary Constituencies Order 2023, from the next general election, due by January 2025, the constituency will be composed of the following (as they existed on 1 December 2020):
- The City of Newcastle upon Tyne ward of Callerton & Throckley.
- The County of Northumberland electoral divisions of: Bellingham; Bywell; Corbridge; Haltwhistle; Haydon and Hadrian; Hexham Central with Acomb; Hexham East; Hexham West; Humshaugh; Longhorsley; Ponteland East and Stannington; Ponteland North; Ponteland South with Heddon; Ponteland West; Prudhoe North; Prudhoe South; South Tyneside; Stocksfield and Broomhaugh.[18]
The constituency will be expanded to bring the electorate within the permitted range, by adding the Newcastle ward of Callerton & Throckley. The boundaries within Northumberland will be adjusted slightly to take account of the reorganisation of local authority electoral divisions.
Members of Parliament
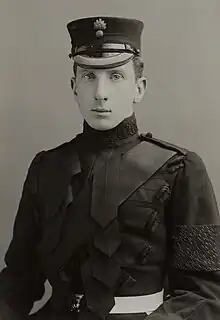
Colonel Douglas Clifton Brown, who was Speaker of the House of Commons during the latter years of the World War II, represented the seat for two separate tenures (from 1918-23, and again from 1924-51).
Elections
Elections in the 2020s
| Party | Candidate | Votes | % | ±% | |
|---|---|---|---|---|---|
| SDP | William Clouston[20] | ||||
| Liberal Democrats | Nick Cott[21] | ||||
| Labour | Joe Morris[22] | ||||
| Conservative | Guy Opperman[23] | ||||
Elections in the 2010s
| Party | Candidate | Votes | % | ±% | |
|---|---|---|---|---|---|
| Conservative | Guy Opperman | 25,152 | 54.5 | ||
| Labour | Penny Grennan | 14,603 | 31.6 | ||
| Liberal Democrats | Stephen Howse | 4,672 | 10.1 | ||
| Green | Nick Morphet | 1,723 | 3.7 | ||
| Majority | 10,549 | 22.9 | |||
| Turnout | 46,150 | 75.3 | |||
| Conservative hold | Swing | ||||
| Party | Candidate | Votes | % | ±% | |
|---|---|---|---|---|---|
| Conservative | Guy Opperman | 24,996 | 54.1 | ||
| Labour Co-op | Stephen Powers | 15,760 | 34.1 | ||
| Liberal Democrats | Fiona Hall | 3,285 | 7.1 | ||
| Green | Wesley Foot | 1,253 | 2.7 | ||
| UKIP | Francis Miles | 930 | 2.0 | ||
| Majority | 9,236 | 20.0 | |||
| Turnout | 46,224 | 75.1 | |||
| Conservative hold | Swing | ||||
| Party | Candidate | Votes | % | ±% | |
|---|---|---|---|---|---|
| Conservative | Guy Opperman | 22,834 | 52.7 | ||
| Labour | Liam Carr | 10,803 | 24.9 | ||
| UKIP | David Nicholson | 4,302 | 9.9 | New | |
| Liberal Democrats | Jeff Reid[26] | 2,961 | 6.8 | ||
| Green | Lee Williscroft-Ferris | 2,445 | 5.6 | New | |
| Majority | 12,031 | 27.8 | |||
| Turnout | 43,345 | 71.5 | |||
| Conservative hold | Swing | ||||
| Party | Candidate | Votes | % | ±% | |
|---|---|---|---|---|---|
| Conservative | Guy Opperman | 18,795 | 43.2 | ||
| Liberal Democrats | Andrew Duffield | 13,007 | 29.9 | ||
| Labour | Antoine Tinnion | 8,253 | 19.0 | ||
| Independent | Steven Ford | 1,974 | 4.5 | New | |
| BNP | Quentin Hawkins | 1,205 | 2.8 | New | |
| Independent | Colin Moss | 249 | 0.6 | New | |
| Majority | 5,788 | 13.3 | |||
| Turnout | 43,483 | 70.8 | |||
| Conservative hold | Swing | ||||
Elections in the 2000s
| Party | Candidate | Votes | % | ±% | |
|---|---|---|---|---|---|
| Conservative | Peter Atkinson | 17,605 | 42.4 | −2.2 | |
| Labour | Kevin Graham | 12,585 | 30.3 | −8.3 | |
| Liberal Democrats | Andrew Duffield | 10,673 | 25.7 | +10.7 | |
| English Democrat | Ian Riddell | 521 | 1.3 | New | |
| Imperial | Thomas Davison | 129 | 0.3 | New | |
| Majority | 5,020 | 12.1 | +6.1 | ||
| Turnout | 41,513 | 68.8 | −2.1 | ||
| Conservative hold | Swing | +3.0 | |||
| Party | Candidate | Votes | % | ±% | |
|---|---|---|---|---|---|
| Conservative | Peter Atkinson | 18,917 | 44.6 | +5.8 | |
| Labour | Paul Brannen | 16,388 | 38.6 | +0.4 | |
| Liberal Democrats | Philip Latham | 6,380 | 15.0 | −2.4 | |
| UKIP | Alan Patterson | 728 | 1.7 | −0.9 | |
| Majority | 2,529 | 6.0 | +5.4 | ||
| Turnout | 42,413 | 70.9 | −6.6 | ||
| Conservative hold | Swing | ||||
Elections in the 1990s
| Party | Candidate | Votes | % | ±% | |
|---|---|---|---|---|---|
| Conservative | Peter Atkinson | 17,701 | 38.8 | -13.6 | |
| Labour | Ian McMinn | 17,479 | 38.2 | +14.0 | |
| Liberal Democrats | Philip Carr | 7,959 | 17.4 | -4.3 | |
| Referendum | Robert Waddell | 1,362 | 3.0 | New | |
| UKIP | David Lott | 1,170 | 2.6 | New | |
| Majority | 222 | 0.6 | -27.6 | ||
| Turnout | 45,671 | 77.5 | -4.9 | ||
| Conservative hold | Swing | +13.8 | |||
| Party | Candidate | Votes | % | ±% | |
|---|---|---|---|---|---|
| Conservative | Peter Atkinson | 24,967 | 52.4 | +2.8 | |
| Labour | Ian Swithenbank | 11,529 | 24.2 | +6.2 | |
| Liberal Democrats | Jonathan Wallace | 10,344 | 21.7 | −10.0 | |
| Green | John Hartshorne | 781 | 1.6 | +0.9 | |
| Majority | 13,438 | 28.2 | +10.3 | ||
| Turnout | 47,621 | 82.4 | +2.4 | ||
| Conservative hold | Swing | −1.7 | |||
Elections in the 1980s
| Party | Candidate | Votes | % | ±% | |
|---|---|---|---|---|---|
| Conservative | Alan Amos | 22,370 | 49.6 | -1.9 | |
| Liberal | Euan Robson | 14,304 | 31.7 | +0.2 | |
| Labour | Mike Wood | 8,103 | 18.0 | +1.0 | |
| Green | Sheila Wood | 336 | 0.7 | New | |
| Majority | 8,066 | 17.9 | -2.1 | ||
| Turnout | 45,113 | 80.0 | +6.6 | ||
| Conservative hold | Swing | ||||
| Party | Candidate | Votes | % | ±% | |
|---|---|---|---|---|---|
| Conservative | Geoffrey Rippon | 21,374 | 51.5 | +3.5 | |
| Liberal | Euan Robson | 13,066 | 31.5 | +11.4 | |
| Labour | Stephen Byers | 7,056 | 17.0 | -14.9 | |
| Majority | 8,308 | 20.0 | +3.9 | ||
| Turnout | 41,496 | 73.4 | -6.1 | ||
| Conservative hold | Swing | ||||
Elections in the 1970s
| Party | Candidate | Votes | % | ±% | |
|---|---|---|---|---|---|
| Conservative | Geoffrey Rippon | 25,483 | 47.98 | ||
| Labour | Stuart Bell | 16,935 | 31.88 | ||
| Liberal | John Shipley | 10,697 | 20.14 | ||
| Majority | 8,548 | 16.10 | |||
| Turnout | 53,115 | 79.50 | |||
| Conservative hold | Swing | ||||
| Party | Candidate | Votes | % | ±% | |
|---|---|---|---|---|---|
| Conservative | Geoffrey Rippon | 21,352 | 43.53 | ||
| Labour | Eric Wade | 16,711 | 34.07 | ||
| Liberal | Roy Cairncross | 10,991 | 22.41 | ||
| Majority | 4,641 | 9.46 | |||
| Turnout | 49,054 | 75.37 | |||
| Conservative hold | Swing | ||||
| Party | Candidate | Votes | % | ±% | |
|---|---|---|---|---|---|
| Conservative | Geoffrey Rippon | 24,059 | 45.46 | ||
| Labour | Eric Wade | 16,129 | 30.48 | ||
| Liberal | Roy Cairncross | 12,730 | 24.06 | ||
| Majority | 7,930 | 14.98 | |||
| Turnout | 52,918 | 82.62 | |||
| Conservative hold | Swing | ||||
| Party | Candidate | Votes | % | ±% | |
|---|---|---|---|---|---|
| Conservative | Geoffrey Rippon | 24,516 | 51.96 | ||
| Labour | John E Miller | 16,645 | 35.28 | ||
| Liberal | David Cogan | 6,021 | 12.76 | ||
| Majority | 7,871 | 16.68 | |||
| Turnout | 47,182 | 75.31 | |||
| Conservative hold | Swing | ||||
Elections in the 1960s
| Party | Candidate | Votes | % | ±% | |
|---|---|---|---|---|---|
| Conservative | Geoffrey Rippon | 20,889 | 48.10 | ||
| Labour Co-op | James B. Lamb | 16,105 | 37.08 | ||
| Liberal | Douglas A. Robson | 6,434 | 14.82 | ||
| Majority | 4,784 | 11.02 | |||
| Turnout | 43,428 | 78.05 | |||
| Conservative hold | Swing | ||||
| Party | Candidate | Votes | % | ±% | |
|---|---|---|---|---|---|
| Conservative | Rupert Speir | 22,468 | 50.70 | ||
| Labour | John Alderson | 14,127 | 31.88 | ||
| Liberal | Douglas A. Robson | 7,722 | 17.42 | New | |
| Majority | 8,341 | 18.82 | |||
| Turnout | 44,317 | 81.88 | |||
| Conservative hold | Swing | ||||
Elections in the 1950s
| Party | Candidate | Votes | % | ±% | |
|---|---|---|---|---|---|
| Conservative | Rupert Speir | 25,500 | 62.99 | ||
| Labour | Wilfrid Roberts | 14,980 | 37.01 | ||
| Majority | 10,520 | 25.98 | |||
| Turnout | 40,480 | 81.11 | |||
| Conservative hold | Swing | ||||
| Party | Candidate | Votes | % | ±% | |
|---|---|---|---|---|---|
| Conservative | Rupert Speir | 23,462 | 64.00 | ||
| Labour | Edward Garrett | 13,198 | 36.00 | ||
| Majority | 10,264 | 28.00 | |||
| Turnout | 36,660 | 77.28 | |||
| Conservative hold | Swing | ||||
| Party | Candidate | Votes | % | ±% | |
|---|---|---|---|---|---|
| Conservative | Rupert Speir | 23,267 | 59.61 | New | |
| Labour Co-op | Thomas L. MacDonald | 15,768 | 40.39 | ||
| Majority | 7,499 | 19.22 | N/A | ||
| Turnout | 39,035 | 82.42 | |||
| Conservative gain from Speaker | Swing | ||||
| Party | Candidate | Votes | % | ±% | |
|---|---|---|---|---|---|
| Speaker | Douglas Clifton Brown | 24,703 | 85.06 | ||
| Independent Liberal | Alexander Hancock | 4,154 | 14.40 | New | |
| Majority | 20,549 | 71.66 | |||
| Turnout | 28,857 | 61.88 | |||
| Speaker hold | Swing | ||||
Elections in the 1940s
| Party | Candidate | Votes | % | ±% | |
|---|---|---|---|---|---|
| Speaker | Douglas Clifton Brown | 16,431 | 58.23 | ||
| Labour | Ernest Kavanagh | 11,786 | 41.77 | ||
| Majority | 4,645 | 16.46 | |||
| Turnout | 28,217 | 73.80 | |||
| Speaker hold | Swing | ||||
- 1943: Douglas Clifton-Brown becomes Speaker of the House of Commons.
Elections in the 1930s
| Party | Candidate | Votes | % | ±% | |
|---|---|---|---|---|---|
| Conservative | Douglas Clifton Brown | 17,241 | 62.55 | ||
| Labour | Ernest Kinghorn | 10,324 | 37.45 | ||
| Majority | 6,917 | 25.10 | |||
| Turnout | 27,565 | 75.92 | |||
| Conservative hold | Swing | ||||
| Party | Candidate | Votes | % | ±% | |
|---|---|---|---|---|---|
| Conservative | Douglas Clifton Brown | 20,578 | 73.14 | ||
| Labour | E. O. Dunnico | 7,557 | 26.86 | ||
| Majority | 13,021 | 46.28 | |||
| Turnout | 28,135 | 79.21 | |||
| Conservative hold | Swing | ||||
Elections in the 1920s
| Party | Candidate | Votes | % | ±% | |
|---|---|---|---|---|---|
| Unionist | Douglas Clifton Brown | 11,069 | 39.1 | −8.9 | |
| Liberal | Francis Acland | 9,103 | 32.2 | +2.9 | |
| Labour | Ernest Owen Dunnico | 8,135 | 28.7 | +6.0 | |
| Majority | 1,966 | 6.9 | −11.8 | ||
| Turnout | 28,307 | 80.2 | −2.0 | ||
| Registered electors | 35,304 | ||||
| Unionist hold | Swing | −5.9 | |||
| Party | Candidate | Votes | % | ±% | |
|---|---|---|---|---|---|
| Unionist | Douglas Clifton Brown | 10,741 | 48.0 | +4.0 | |
| Liberal | Victor Finney | 6,551 | 29.3 | −26.7 | |
| Labour | Charles Flynn | 5,089 | 22.7 | New | |
| Majority | 4,190 | 18.7 | N/A | ||
| Turnout | 22,381 | 82.2 | +6.6 | ||
| Registered electors | 27,237 | ||||
| Unionist gain from Liberal | Swing | +15.4 | |||
| Party | Candidate | Votes | % | ±% | |
|---|---|---|---|---|---|
| Liberal | Victor Finney | 11,293 | 56.0 | +25.0 | |
| Unionist | Douglas Clifton Brown | 8,887 | 44.0 | −0.8 | |
| Majority | 2,406 | 12.0 | N/A | ||
| Turnout | 20,180 | 75.6 | −3.7 | ||
| Registered electors | 26,732 | ||||
| Liberal gain from Unionist | Swing | +12.9 | |||
| Party | Candidate | Votes | % | ±% | |
|---|---|---|---|---|---|
| Unionist | Douglas Clifton Brown | 9,369 | 44.8 | −4.1 | |
| Liberal | Victor Finney | 6,486 | 31.0 | +6.1 | |
| Labour | George Shield | 5,050 | 24.2 | −2.0 | |
| Majority | 2,883 | 13.8 | −8.9 | ||
| Turnout | 20,905 | 79.3 | +16.9 | ||
| Registered electors | 26,372 | ||||
| Unionist hold | Swing | −5.1 | |||
Elections in the 1910s
| Party | Candidate | Votes | % | ±% | |
|---|---|---|---|---|---|
| C | Unionist | Douglas Clifton Brown | 7,763 | 48.9 | +3.1 |
| Labour | William Weir | 4,168 | 26.2 | New | |
| Liberal | Wentworth Beaumont | 3,948 | 24.9 | −29.3 | |
| Majority | 3,595 | 22.7 | N/A | ||
| Turnout | 15,879 | 62.4 | −21.0 | ||
| Registered electors | 25,341 | ||||
| Unionist gain from Liberal | Swing | +16.2 | |||
| C indicates candidate endorsed by the coalition government. | |||||
General Election 1914–15:
Another General Election was required to take place before the end of 1915. The political parties had been making preparations for an election to take place and by July 1914, the following candidates had been selected:
- Liberal: Richard Durning Holt
- Unionist: Alan Percy[37]

| Party | Candidate | Votes | % | ±% | |
|---|---|---|---|---|---|
| Liberal | Richard Durning Holt | 5,124 | 54.2 | −1.2 | |
| Conservative | Alfred Henry Chaytor | 4,334 | 45.8 | +1.2 | |
| Majority | 790 | 8.4 | −2.4 | ||
| Turnout | 9,458 | 83.4 | −3.9 | ||
| Registered electors | 11,335 | ||||
| Liberal hold | Swing | −1.2 | |||
| Party | Candidate | Votes | % | ±% | |
|---|---|---|---|---|---|
| Liberal | Richard Durning Holt | 5,478 | 55.4 | −6.0 | |
| Conservative | Charles Loftus Bates | 4,417 | 44.6 | +6.0 | |
| Majority | 1,061 | 10.8 | −12.0 | ||
| Turnout | 9,895 | 87.3 | +4.2 | ||
| Registered electors | 11,335 | ||||
| Liberal hold | Swing | −6.0 | |||
Elections in the 1900s
| Party | Candidate | Votes | % | ±% | |
|---|---|---|---|---|---|
| Liberal | Richard Durning Holt | 5,401 | 56.0 | −5.4 | |
| Conservative | Charles Loftus Bates | 4,244 | 44.0 | +5.4 | |
| Majority | 1,157 | 12.0 | −10.8 | ||
| Turnout | 9,645 | 86.8 | +3.7 | ||
| Registered electors | 11,116 | ||||
| Liberal hold | Swing | −5.4 | |||
| Party | Candidate | Votes | % | ±% | |
|---|---|---|---|---|---|
| Liberal | Wentworth Beaumont | 5,632 | 61.4 | +10.3 | |
| Conservative | Nathaniel George Clayton | 3,547 | 38.6 | −10.3 | |
| Majority | 2,085 | 22.8 | +20.6 | ||
| Turnout | 9,179 | 83.1 | +3.5 | ||
| Registered electors | 11,049 | ||||
| Liberal hold | Swing | +10.3 | |||

| Party | Candidate | Votes | % | ±% | |
|---|---|---|---|---|---|
| Liberal | Wentworth Beaumont | 4,197 | 51.1 | −1.5 | |
| Liberal Unionist | Charles Howard | 4,011 | 48.9 | +1.5 | |
| Majority | 186 | 2.2 | −3.0 | ||
| Turnout | 8,208 | 79.6 | −2.2 | ||
| Registered electors | 10,310 | ||||
| Liberal hold | Swing | −1.5 | |||
Elections in the 1890s

| Party | Candidate | Votes | % | ±% | |
|---|---|---|---|---|---|
| Liberal | Wentworth Beaumont | 4,438 | 52.6 | +3.1 | |
| Conservative | Charles Edward Hunter | 4,003 | 47.4 | −3.1 | |
| Majority | 435 | 5.2 | N/A | ||
| Turnout | 8,441 | 81.8 | +0.4 | ||
| Registered electors | 10,316 | ||||
| Liberal gain from Conservative | Swing | +3.1 | |||
| Party | Candidate | Votes | % | ±% | |
|---|---|---|---|---|---|
| Liberal | Miles MacInnes | 4,804 | 52.4 | +2.9 | |
| Conservative | Richard Clayton | 4,358 | 47.6 | −2.9 | |
| Majority | 446 | 4.8 | N/A | ||
| Turnout | 9,162 | 87.3 | +5.9 | ||
| Registered electors | 10,494 | ||||
| Liberal gain from Conservative | Swing | +2.9 | |||
- Caused after the 1892 result was declared void on petition.
| Party | Candidate | Votes | % | ±% | |
|---|---|---|---|---|---|
| Conservative | *Nathaniel George Clayton | 4,092 | 50.5 | +7.0 | |
| Liberal | Miles MacInnes | 4,010 | 49.5 | -7.0 | |
| Majority | 82 | 1.0 | N/A | ||
| Turnout | 8,102 | 81.4 | +9.1 | ||
| Registered electors | 9,954 | ||||
| Conservative gain from Liberal | Swing | +7.0 | |||
- Clayton was unseated on petition
Elections in the 1880s

| Party | Candidate | Votes | % | ±% | |
|---|---|---|---|---|---|
| Liberal | Miles MacInnes | 4,177 | 56.5 | -2.1 | |
| Conservative | Viscount Melgund | 3,220 | 43.5 | +2.1 | |
| Majority | 957 | 13.0 | -4.2 | ||
| Turnout | 7,397 | 72.3 | −14.2 | ||
| Registered electors | 10,237 | ||||
| Liberal hold | Swing | -2.1 | |||

| Party | Candidate | Votes | % | ±% | |
|---|---|---|---|---|---|
| Liberal | Miles MacInnes | 5,193 | 58.6 | ||
| Conservative | Matthew Ridley | 3,663 | 41.4 | ||
| Majority | 1,530 | 17.2 | |||
| Turnout | 8,856 | 86.5 | |||
| Registered electors | 10,237 | ||||
| Liberal win (new seat) | |||||
See also
Notes
- ↑ A county constituency (for the purposes of election expenses and type of returning officer)
References
- Specific
- ↑ "Electorate Figures – Boundary Commission for England". 2011 Electorate Figures. Boundary Commission for England. 4 March 2011. Archived from the original on 6 November 2010. Retrieved 13 March 2011.
- 1 2 Great Britain, Incorporated Council of Law Reporting for England and Wales. The public general acts. unknown library. Proprietors of the Law Journal Reports, 1884. p. 167.
- ↑ Waller, Robert; Criddle, Byron (2007). The Almanac of British Politics. Taylor & Francis. p. 538. ISBN 9780415378246.
- ↑ "OS Maps – online and App mapping system | Ordnance Survey Shop". getamap.ordnancesurvey.co.uk.
- ↑ "Election seats to watch". The Guardian. 30 March 2001. Retrieved 13 April 2022.
- ↑ "2011 census interactive maps". Archived from the original on 29 January 2016.
- ↑ "Local statistics – Office for National Statistics". www.ons.gov.uk.
- ↑ "EU referendum: Constituency results". House of Commons Library.
- ↑ Fraser, Hugh (1918). The Representation of the People Act, 1918: with explanatory notes. London: Sweet and Maxwell.
- ↑ Craig, Fred W. S. (1972). Boundaries of parliamentary constituencies 1885-1972;. Chichester: Political Reference Publications. p. 25. ISBN 0-900178-09-4. OCLC 539011.
- ↑ Craig, Fred W. S. (1972). Boundaries of parliamentary constituencies 1885-1972;. Chichester: Political Reference Publications. pp. 81, 139. ISBN 0-900178-09-4. OCLC 539011.
- ↑ "Representation of the People Act 1948: Schedule 1", legislation.gov.uk, The National Archives, 1948 c. 65 (sch. 1), retrieved 28 February 2023
- ↑ "The Parliamentary Constituencies (Blyth and Hexham) Order 1971. SI 1971/2107". Statutory Instruments 1971. Part III Section 2. London: Her Majesty's Stationery Office. 1972. pp. 6217–6218.
- ↑ "The Parliamentary Constituencies (England) Order 1983" (PDF). p. 62.
- ↑ "The Parliamentary Constituencies (England) Order 1995". In the County of Northumberland.
- ↑ "The Parliamentary Constituencies (England) Order 2007". In Northumberland.
- ↑ "Northumberland | History, Facts, & Points of Interest | Britannica". www.britannica.com. Retrieved 13 September 2022.
- ↑ "The Parliamentary Constituencies Order 2023". Schedule 1 Part 4 North East region.
- ↑ Leigh Rayment's Historical List of MPs – Constituencies beginning with "H" (part 3)
- ↑ "General Election Candidates". Social Democratic Party. Retrieved 28 December 2023.
- ↑ "Newcastle councillor selected as Lib Dem candidate for the Hexham constituency". Chronicle Live. The Chronicle. Retrieved 9 December 2023.
- ↑ "Hexham Labour members pick General Election candidate". Hexham Courant. Hexham Courant. Retrieved 9 December 2023.
- ↑ "Guy Opperman re-selected to stand for Hexham at next General Election". Hexham Courant. Hexham Courant. Retrieved 9 December 2023.
- ↑ "Hexham Parliamentary constituency". BBC News. BBC. Retrieved 24 November 2019.
- ↑ "Election Data 2015". Electoral Calculus. Archived from the original on 17 October 2015. Retrieved 17 October 2015.
- ↑ Daniel, Brian. "Lib Dem Jeff Reid to battle Tory MP Guy Opperman at general election – The Journal". www.thejournal.co.uk.
- ↑ "Election Data 2010". Electoral Calculus. Archived from the original on 26 July 2013. Retrieved 17 October 2015.
- ↑ "BBC NEWS – Election 2010 – Hexham". BBC News.
- ↑ "Election Data 2005". Electoral Calculus. Archived from the original on 15 October 2011. Retrieved 18 October 2015.
- ↑ "Election Data 2001". Electoral Calculus. Archived from the original on 15 October 2011. Retrieved 18 October 2015.
- ↑ "Election Data 1997". Electoral Calculus. Archived from the original on 15 October 2011. Retrieved 18 October 2015.
- ↑ "Election Data 1992". Electoral Calculus. Archived from the original on 15 October 2011. Retrieved 18 October 2015.
- ↑ "Politics Resources". Election 1992. Politics Resources. 9 April 1992. Archived from the original on 24 July 2011. Retrieved 6 December 2010.
- ↑ "Election Data 1987". Electoral Calculus. Archived from the original on 15 October 2011. Retrieved 18 October 2015.
- ↑ "Election Data 1983". Electoral Calculus. Archived from the original on 15 October 2011. Retrieved 18 October 2015.
- ↑ The Times' Guide to the House of Commons. 1951.
- ↑ Newcastle Journal 12 March 1914
- 1 2 3 4 5 6 7 8 9 10 Craig, FWS, ed. (1974). British Parliamentary Election Results: 1885–1918. London: Macmillan Press. ISBN 9781349022984.
- 1 2 Debrett's House of Commons & Judicial Bench, 1916
- 1 2 3 4 5 6 7 The Liberal Year Book, 1907
- 1 2 Debrett's House of Commons & Judicial Bench, 1901
- ↑ Debrett's House of Commons & Judicial Bench, 1886
- General
Craig, F. W. S. (1983). British parliamentary election results 1918–1949 (3 ed.). Chichester: Parliamentary Research Services. ISBN 0-900178-06-X.