| |||||||||||||||||||||||||||||||||
11 of the 33 seats to City of Lincoln Council 17 seats needed for a majority | |||||||||||||||||||||||||||||||||
|---|---|---|---|---|---|---|---|---|---|---|---|---|---|---|---|---|---|---|---|---|---|---|---|---|---|---|---|---|---|---|---|---|---|
| |||||||||||||||||||||||||||||||||
 Map showing the results of the 2004 Lincoln City Council elections by ward. Red shows Labour seats, blue shows Conservative seats and orange shows Liberal Democrat seats. | |||||||||||||||||||||||||||||||||
| |||||||||||||||||||||||||||||||||
Elections to City of Lincoln Council in Lincolnshire, England, were held on 10 June 2004. One third of the council was up for election and the Labour Party stayed in overall control of the council.
After the election, the composition of the council was:
- Labour 25
- Conservative 7
- Liberal Democrat 1
Election result
| Party | Seats | Gains | Losses | Net gain/loss | Seats % | Votes % | Votes | +/− | |
|---|---|---|---|---|---|---|---|---|---|
| Conservative | 5 | 1 | 0 | 45.5 | 40.2 | 9,689 | |||
| Labour | 5 | 0 | 2 | 45.5 | 39.2 | 9,450 | |||
| Liberal Democrats | 1 | 1 | 0 | 9.1 | 13.3 | 3,211 | |||
| Lincoln Independent Alliance | 0 | 0 | 0 | 0.0 | 5.0 | 1,218 | |||
| Socialist Alternative | 0 | 0 | 0 | 0.0 | 1.4 | 329 | |||
| Independent | 0 | 0 | 0 | 0.0 | 0.9 | 222 | |||
All comparisons in vote share are to the corresponding 2000 election.
Ward results
Abbey

Location of Abbey ward
| Party | Candidate | Votes | % | |
|---|---|---|---|---|
| Labour | Fay Smith | 703 | 42.1 | |
| Liberal Democrats | John Margetts | 489 | 29.3 | |
| Conservative | Anne Duguid | 479 | 28.7 | |
| Majority | 214 | 12.8 | ||
| Turnout | 1,671 | 40.0% | ||
| Labour hold | ||||
Birchwood

Location of Birchwood ward
| Party | Candidate | Votes | % | |
|---|---|---|---|---|
| Conservative | Edmund Strengiel | 1,015 | 48.3 | |
| Labour | Julie Cooper | 756 | 36.0 | |
| Socialist Alternative | Ryan Hayward | 329 | 15.7 | |
| Majority | 259 | 12.3 | ||
| Turnout | 2,100 | 38.9% | ||
| Conservative hold | ||||
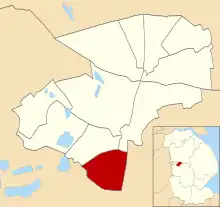
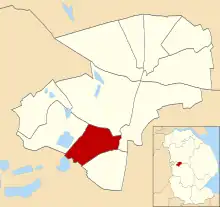
Boultham

Location of Boultham ward
| Party | Candidate | Votes | % | |
|---|---|---|---|---|
| Labour | Amode Toofany | 979 | 43.5 | |
| Liberal Democrats | Jayne Fisk | 637 | 28.3 | |
| Conservative | Darius Laws | 635 | 28.2 | |
| Majority | 342 | 15.2 | ||
| Turnout | 2,251 | 41.4% | ||
| Labour hold | ||||
Bracebridge
Location of Bracebridge ward
| Party | Candidate | Votes | % | |
|---|---|---|---|---|
| Conservative | Hilton Spratt | 1,575 | 59.0 | |
| Labour | Kevin Parnham | 1,093 | 41.0 | |
| Majority | 482 | 18.0 | ||
| Turnout | 2,668 | 43.3% | ||
| Conservative hold | ||||
Carholme

Location of Carholme ward
| Party | Candidate | Votes | % | |
|---|---|---|---|---|
| Labour | Neil Murray | 767 | 36.6 | |
| Liberal Democrats | Charles Shaw | 596 | 28.5 | |
| Conservative | Jayne Harris | 509 | 24.3 | |
| Independent | Peter McGovern | 222 | 10.6 | |
| Majority | 171 | 8.1 | ||
| Turnout | 2,094 | 45.4% | ||
| Labour hold | ||||
Castle

Location of Castle ward
| Party | Candidate | Votes | % | |
|---|---|---|---|---|
| Labour | Donald Nannestad | 790 | 40.7 | |
| Conservative | Michael Reeve | 426 | 21.9 | |
| Liberal Democrats | Phillip Mappin | 372 | 19.2 | |
| Lincoln Independent Alliance | Richard Hall | 353 | 18.2 | |
| Majority | 364 | 18.8 | ||
| Turnout | 1,941 | 42.1% | ||
| Labour hold | ||||
Glebe

Location of Glebe ward
| Party | Candidate | Votes | % | |
|---|---|---|---|---|
| Labour | Lawrence Wells | 926 | 38.2 | |
| Lincoln Independent Alliance | George Spencer | 865 | 35.7 | |
| Conservative | Geoffrey Brooking | 634 | 26.1 | |
| Majority | 61 | 2.5 | ||
| Turnout | 2,425 | 45.4% | ||
| Labour hold | ||||
Hartsholme

Location of Hartsholme ward
| Party | Candidate | Votes | % | |
|---|---|---|---|---|
| Conservative | Ronald Hills | 1,710 | 63.7 | |
| Labour | Elizabeth Jones | 973 | 36.3 | |
| Majority | 737 | 27.4 | ||
| Turnout | 2,683 | 41.6% | ||
| Conservative hold | ||||
Minster
Location of Minster ward
| Party | Candidate | Votes | % | |
|---|---|---|---|---|
| Conservative | David Gratrick | 1,099 | 46.2 | |
| Labour | Winston Duncan | 760 | 32.0 | |
| Liberal Democrats | Daphne Shaw | 518 | 21.8 | |
| Majority | 339 | 14.2 | ||
| Turnout | 2,377 | 46.1% | ||
| Conservative hold | ||||
Moorland
Location of Moorland ward
| Party | Candidate | Votes | % | |
|---|---|---|---|---|
| Conservative | David Bellamy | 1,181 | 51.4 | |
| Labour | Denise Moore | 1,117 | 48.6 | |
| Majority | 64 | 2.8 | ||
| Turnout | 2,298 | 41.6% | ||
| Conservative hold | ||||
Park

Location of Park ward
| Party | Candidate | Votes | % | |
|---|---|---|---|---|
| Liberal Democrats | Heather Quinton | 599 | 37.2 | |
| Labour | Patrick Vaughan | 586 | 36.4 | |
| Conservative | Paul Grice | 426 | 26.4 | |
| Majority | 13 | 0.8 | ||
| Turnout | 1,611 | 33.5% | ||
| Liberal Democrats hold | ||||
References
- ↑ "Council compositions by year". The Elections Centre.
- ↑ "Local Election Summaries 2004". The Elections Centre.
- ↑ "Council by Council - Lincoln". BBC News. Retrieved 2 November 2019.
- 1 2 3 4 5 6 7 8 9 10 11 Andrew Teale. "Local Election Results 2004 - Lincoln". Local Elections Archive Project. Retrieved 5 November 2019.
| Lincolnshire County Council | |||||||||||||||||||||
|---|---|---|---|---|---|---|---|---|---|---|---|---|---|---|---|---|---|---|---|---|---|
| Boston Borough Council | |||||||||||||||||||||
| East Lindsey District Council | |||||||||||||||||||||
| City of Lincoln Council | |||||||||||||||||||||
| North East Lincolnshire Council | |||||||||||||||||||||
| North Kesteven District Council | |||||||||||||||||||||
| North Lincolnshire Council | |||||||||||||||||||||
| South Holland District Council | |||||||||||||||||||||
| South Kesteven District Council | |||||||||||||||||||||
| West Lindsey District Council | |||||||||||||||||||||
| |||||||||||||||||||||
| |||||||||||||||||||||
This article is issued from Wikipedia. The text is licensed under Creative Commons - Attribution - Sharealike. Additional terms may apply for the media files.